Difference between GTMetrix and Google Page Speed Insights

Note
Please note that all our Premium Care plans come with performances optimizations and tailored page speeds improvements. Check our Plans | Check our Features
Site speed is arguably one of the most important metrics for any website — for some sites, the difference of a single second can add up to thousands of dollars of missed (or gained) revenue.
This makes accurately measuring site speed crucial. Unfortunately, site speed isn’t a particularly easy metric to measure. In this article, I’ll show you how to use one of the most popular tools available, GTMetrix, to effectively gauge a website’s speed.
Speed Test Considerations
Many tools — like the aforementioned GTMetrix — are great, but pretty useless if all you do is a one-off speed check. Many factors need to be taken into account if you want to effectively test for speed, but one of the biggest is this: Speed tests need to be done multiple times and averages taken for the results to have any real meaning.
1. NUMBER OF TESTS
To get a really good comprehensive set of data, you need to do a whole lot of speed tests, preferably at different times throughout the day. The ideal would be to schedule an hourly test and leave it running for about a week or so.
The reason for this is that your website’s performance will change throughout the day, depending on your visitor count or even the usage of your server box if you are on a shared host.
A nice side-effect of this test is that you will see your peak hours — which could potentially indicate the best time for you to post new content or target ads/popups, etc, to your visitors.
That said, there’s still plenty to be learned by doing just five or ten tests over the course of an hour or so. Although the actual load speed given in seconds may change over the course of a day (or even week), some of the things GTMetrix can reveal — such as many of the recommendations it will yield on how to go about speeding up your website — will not change with time at all.
2. TEST LOCATIONS
When you use free versions of many speed testing tools (such as Pingdom or Google Page Speed Insights), you’re usually assigned a test server randomly (i.e., the location from which your site is being tested will be random). This can often lead to extremely inconsistent results.
While Test 1 may be performed from New York, for example — 100 miles away from your server — Test 2 could be performed from Sydney, 10,000 miles away from your server. That's why we used a professional account for all our performance tests.
The location you choose to test your site from makes a big difference. For some projects (like local businesses), it may be fine to discard data from locations far away, but in other cases (think sites with a potentially worldwide audience) you’ll want to test globally.
To test locally, select test servers that are near the physical location of your server.
How GTMetrix Works
Basic use of GTMetrix is free. You can go to the main page and start analyzing your site right away. A registered (or even paid account) gives you more options, such as allowing you to choose testing locations, automate testing and more.
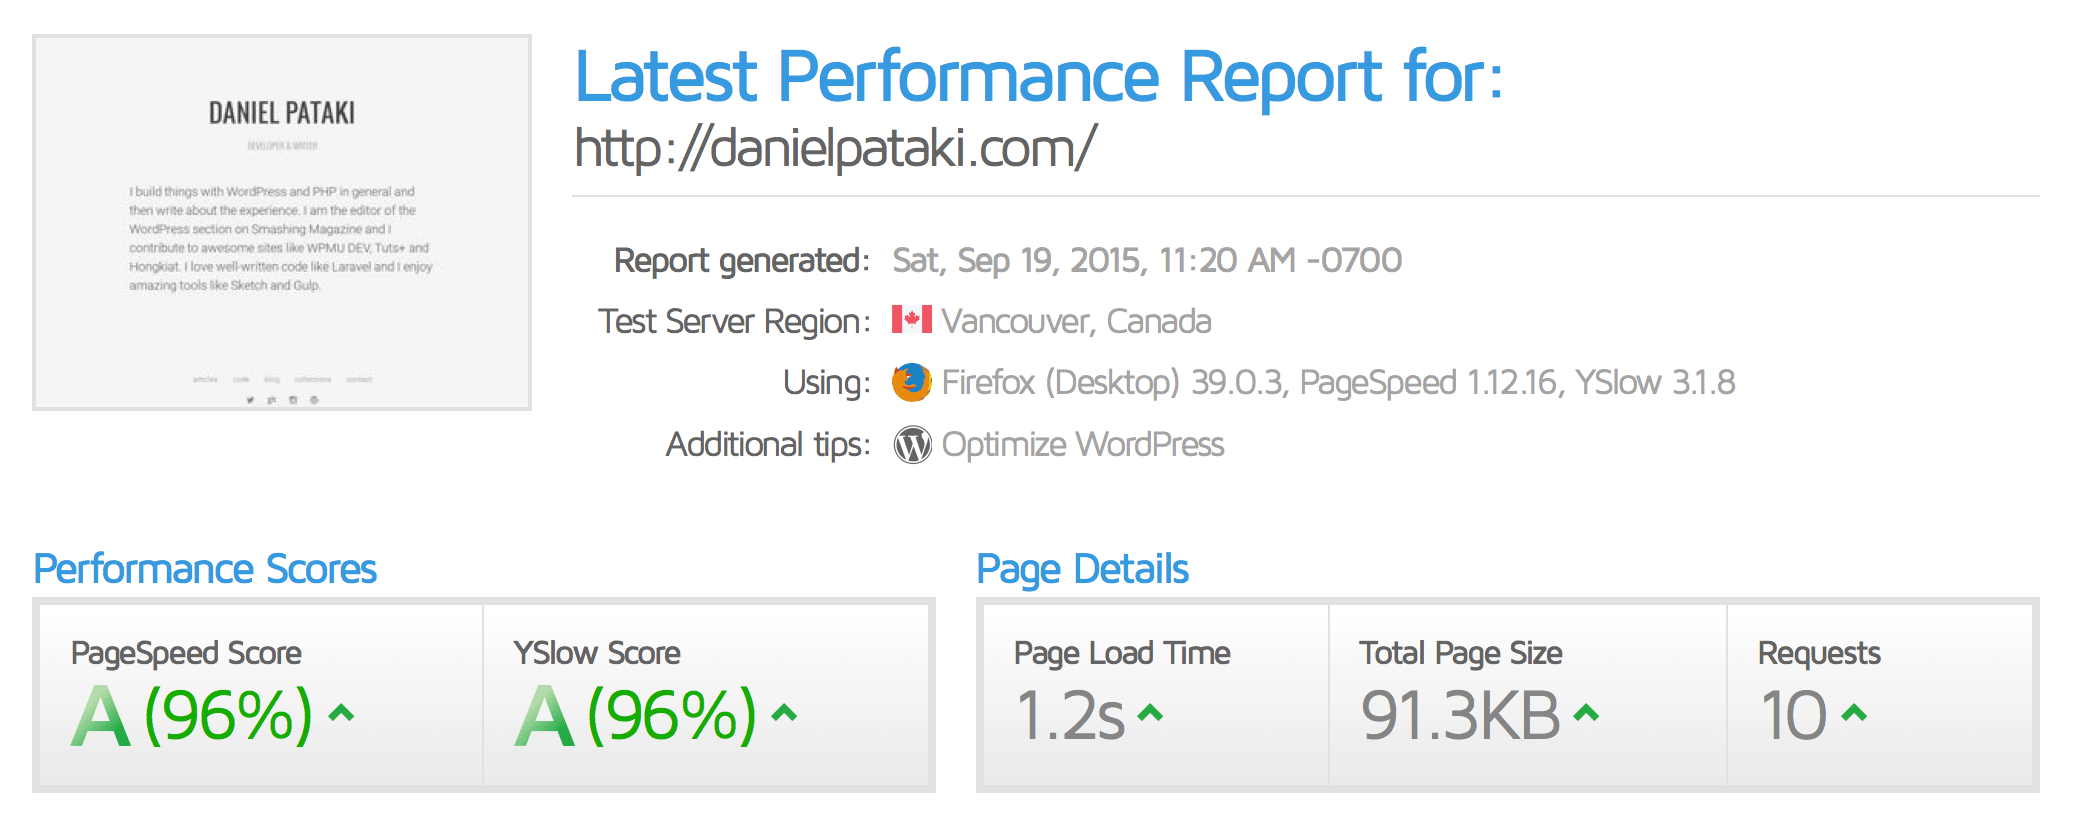
The results overview shows you the browser and location used for testing, PageSpeed and YSlow scores, page load time, number of requests and total page size. These are great for analyzing trends, but if you really want to know why your website is slow, and/or what can be done to further improve things, you’ll need to dig deeper.
PAGESPEED AND YSLOW
PageSpeed and YSlow offer two slightly different methodologies of gauging how a website’s structure and mechanics impact its speed. The results of these contain their own recommendations for making things faster — such as caching, adding expires headers, minifying assets, enabling gzip compression and the like.
The corresponding sections in GTMetrix each link to further information on the topic — so you can read more deeply about it and learn exactly what to do to implement each specific speed increasing method listed.

A key point to note: Don’t chase percentage scores. These can be misleading and don’t necessarily take into account absolutely everything that’s important, like the overall size in megabytes of the page (which, incidentally, is often highly influenced by poorly optimized images). Instead, emphasize the actual page load speed given in seconds — aiming to shave seconds off this (and the ‘critical rendering path’ — more on this below) should be the real goal!
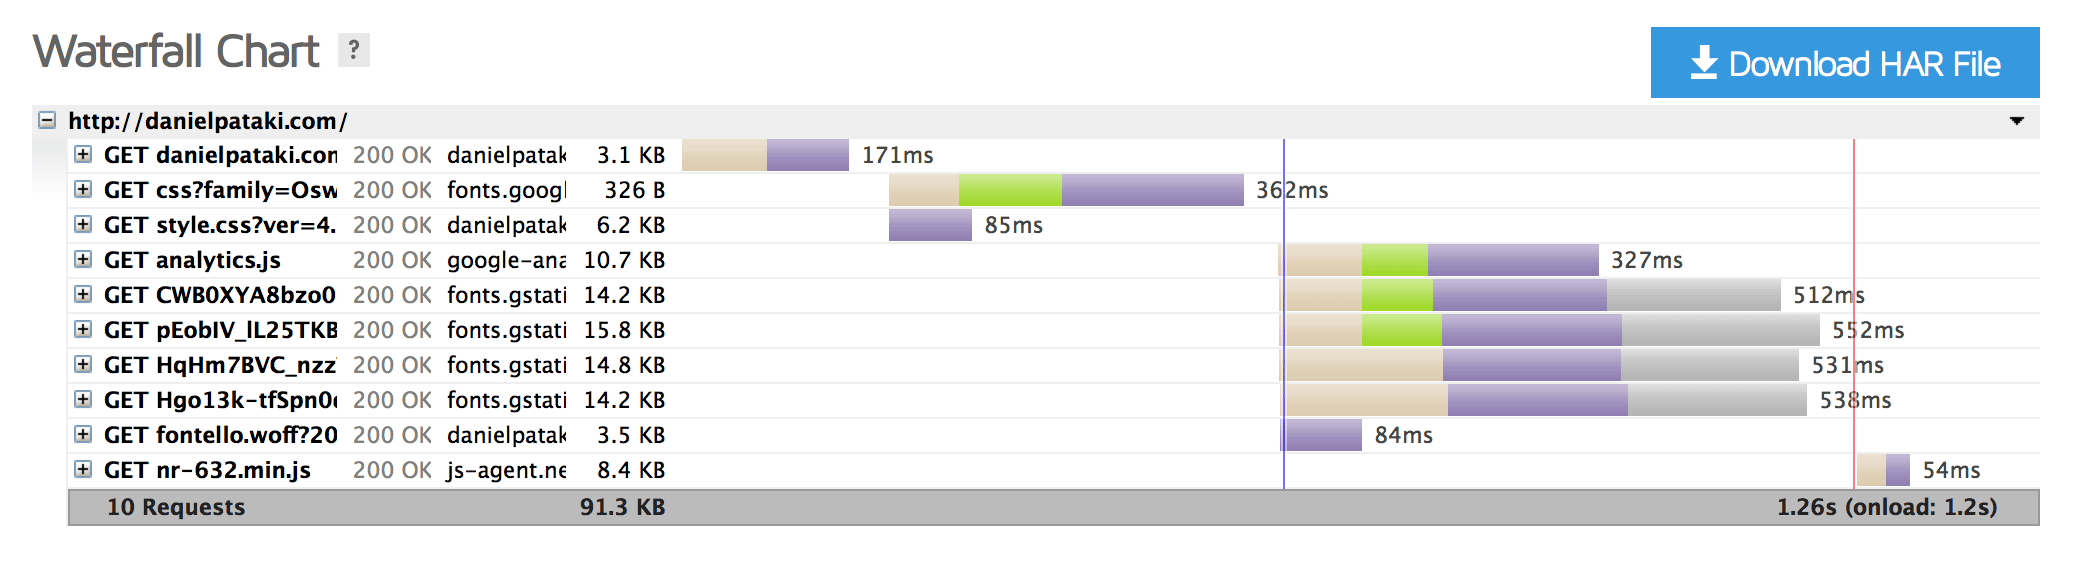
THE WATERFALL
The waterfall is one of the most useful tools for pinpointing bottlenecks in your website’s speed. This particular view is actually very similar to what you may see in browser-based tools, such as the Firebug Net Panel. For more information, take a quick look at this excellent article on how to read waterfalls. If you’re short on time, here’s the nutshell version:
Each asset on your site needs to be looked up, transferred and displayed. Each bar in the waterfall shows all the steps involved for each asset and how long they took.

The steps that each asset can go through are as follows, with a little explanation added:
- DNS Lookup: Time to resolve the DNS
- Connecting: Time taken to create a connection
- Blocking: Time spent in the browser queue waiting for a connection
- Sending: Time taken to send the request
- Waiting: Time spent waiting for the response (time to first byte)
- Receiving: Time taken to download content
Based on this information we can make some assumptions about what’s going on with our website. First of all, take a look at that blue line in the waterfall above. It represents the point at which the DOM was loaded. The red line represents the time the page was loaded.
The time to first byte (TTFB) is also considered an important indicator of your server speed. This is shown by the waiting information in the waterfall. If you’re consistently seeing a high TTFB (even after going through and improving the main recommendations for improving site speed), it may be that your host server is what’s letting you down!
VIDEO AND HISTORY
The last two sections are for premium accounts only. The video shows an actual recording of the site loading — which can show you what all this different data actually amount to. While it’s a nice feature, I don’t find myself using it a whole lot as it is, truth be told, a bit gimmicky, in my opinion.
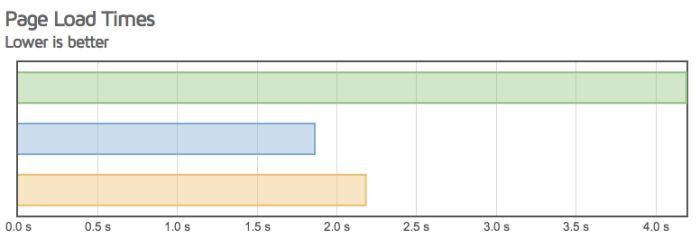
The history tab, however, really is one of the best features because it allows you to view the results of multiple tests on one page in an easy-to-understand, handy graph.

Configuring A Test Suite
You will need a pro account with GTMetrix, which we use mostly for testing all our clients sites and specific technologies of interest.
To begin with, we create all the different tests we need. If you wanted to test 2 pages from 3 locations, we would set up tests for all permutations — which would result in 6 tests. We would then monitor each hourly test for at least a couple of days, ideally a week.
Once a satisfactory amount of time has passed, go into your dashboard, select all tests and compare them. This results in side-by-side data and aggregate graphs.

Speed Tips For WordPress Users
Oh, and if you’re using WordPress (the subject this site is, of course, primarily all about) and happen to be looking for some quick fixes to speed things up: here’s a few very effective tips that almost all WordPress-powered websites could benefit from:
- 1. Ensure whatever web host you’re using uses server’s that are optimized specifically for WordPress — and if you’re still using generic, non-WordPress-optimized shared hosting, switch to something much, much faster, like a Premium Care plan, where we will make sure to optimize your site and greatly improve your site speed.
- 2. If you aren’t already, start using a page caching plugin, such as W3 Total Cache, WP Super Cache or WP Rocket. We install a fully licensed pro version of WP Rocket for all our Premium Care clients.
- 3. Take some time to go through your site’s images and ensure they’re all as optimized as they can be (either re-optimize them in a program like Photoshop or consider using a specialist service/plugin like WP Smush).
- 4. Ensure your website is loading as much of its JavaScript as possible at the bottom of its pages (rather than at the top where it will be delaying the loading of all other page elements).
- 5. As painful as it may be: remove any unnecessary social media profiles from loading on your page (such as Facebook, Twitter and Google+ profiles — all of which can quite literally add seconds to your page load times).
- and 6. Perhaps most important of all: Remove every unnecessary plugin that may be loading all manner of CSS and JavaScript files within your pages — although there is technically no limit to the number of plugins you can install on a WordPress-powered website, a very general rule of thumb is: the more plugins, the slower the site!